Ambari Metrics Part 2 - Service Definition
In the previous post I covered how to send metrics to Ambari, and how to use the Apache Phoenix client to verify the metrics were received. This post will show to integrate those metrics into the Ambari user interface to create a service dashboard.
This post assumes you have a running HDP VM with the Metrics Collector started, and you are able to access the VM via SSH.
Service Definition
The first step is to define an Ambari service to associate with the metrics we are sending. A service is defined by a series of directories containing configuration files and scripts that tell Ambari how to install and manage the service. For a detailed overview of defining a service, see the Ambari Stacks and Services Wiki page.
For this example, we will define the AMSSMOKETESTFAKE service with the following directories and files:
├── common-services
│   └── AMSSMOKETESTFAKE
│       └── 0.1.0
│           ├── configuration
│           ├── metainfo.xml
│           ├── metrics.json
│           ├── package
│           │   ├── archive.zip
│           │   └── scripts
│           │       └── master.py
│           └── widgets.json
└── stacks
    └── HDP
        └── 2.3
            └── services
                └── AMSSMOKETESTFAKE
                    └── metainfo.xml
In order to save time the entire directory structure is available here - amssmoketestfake.
A quick overview of the important files:
- metainfo.xml - defines the overall service
- metrics.json - defines metrics that will be available for display
- widgets.json - uses metrics from metrics.json to defines widgets for the service dashboard
Deploying the Service
The service definition is meant to be copied to the ambari-server installation on the HDP VM at /var/lib/ambari-server/resources.
The deploy script at the root of the service definition contains the scp commands to copy the structure to the HDP VM. Alternatively you could use any other means to copy the files.
After copying the files the ambari-server process needs to be restarted. This can be done by starting and stopping the HDP VM, or by issuing “ambari-server restart” and “ambari-agent restart” from the command line on the VM.
Service Installation
At this point Ambari knows about the service definition and we can issue the necessary commands to install the service. Using your tool of choice, issue the following POST operations:
- services/AMSSMOKETESTFAKE
- services/AMSSMOKETESTFAKE/components/AMSSMOKETESTFAKE_MASTER
- hosts/sandbox.hortonworks.com/host_components/AMSSMOKETESTFAKE_MASTER
Assuming a successful response from the above commands, the AMSSMOKETESTFAKE service should now be visible in the Ambari user interface and will say “Install Pending”.
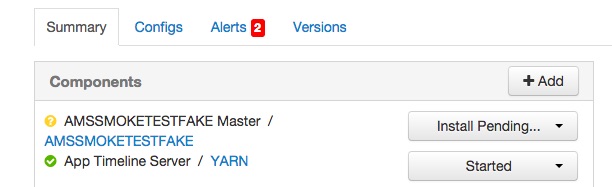
Select the option from the menu to Re-Install the service. When that finishes select the option to Start the service. From there you should be able to see the service dashboard with one widget defined for FakeMetric, but no data available.
Sending Metrics
In order to test sending metrics I created a simple Java program that will post example metrics corresponding with the amssmoketestfake service. To start producing metrics do the following:
git clone https://github.com/bbende/ambari-metric-producer
cd ambari-metric-producer
mvn clean package
java -jar target/amabri-metric-producer-1.0-SNAPSHOT.jar
This will produce 100 metrics with a 5 second delay between each, more than enough to start seeing them in the Ambari user interface.
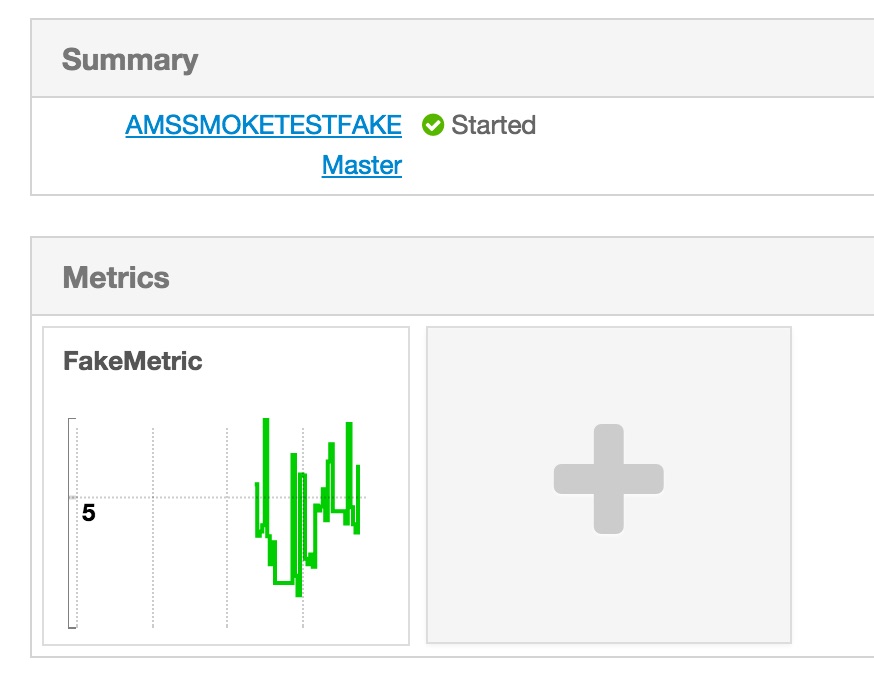
Viewing Metrics
After running the metric producer for a few minutes, the FakeMetric widget on the AMSSMOKETESTFAKE service page should eventually show data:
Summary
If you followed all of these steps you should have a working example demonstrating how to define a service and visualize metrics through the service dashboard. The Ambari Wiki is the best place to go for further information on what can be done with metrics and widgets.
blog comments powered by Disqus