Apache NiFi - Processing Multi-line Logs
A popular use-case for Apache NiFi has been receiving and processing log messages from a variety of data sources. There are many different ways of getting logs into NiFi, but the most common approach is via one of the network listening processors, such as ListenTCP, ListenUDP, or ListenSyslog. For some background on how these processors work, you can read this.
A common request has been for ListenTCP (or ListenSyslog in TCP mode) to handle multi-line log messages. These processors currently use a new-line character to determine logical message boundaries, which doesn’t work well when a new-line is part of the message. For example, when receiving a Java stack-trace there will be many new-lines, but the whole stack-trace is intended to be a single message.
A possible solution to this problem is to put the log messages into a structured format, such as JSON, and then escape the new-lines. There are several plugins/formats for the most popular logging libraries that can help with this, but sometimes you can’t change the data source and are stuck with the data already being produced.
The Apache NiFi 1.4.0 release introduced a new ListenTCPRecord processor which can provide additional flexibility when processing an incoming stream of logs.
ListenTCPRecord
ListenTCPRecord starts a standard Java ServerSocket to listen for incoming TCP connections. Upon accepting a connection, the InputStream of the connected socket is then passed directly to a configured record reader.
What does this mean?
We are no longer stuck using a new-line as the delimiter! We can now interpret the incoming data using any of the available record readers, which means we can process a stream of unstructured text (i.e. logs) using the GrokReader.
The GrokReader was introduced in the 1.2.0 release, and applies a grok expression to interpret the content of a flow file as a series of records. The additional details page shows an example of how to process logs with stack-traces coming from NiFi itself.
Let’s take that example and show how that would work with ListenTCPRecord…
GrokReader Example
-
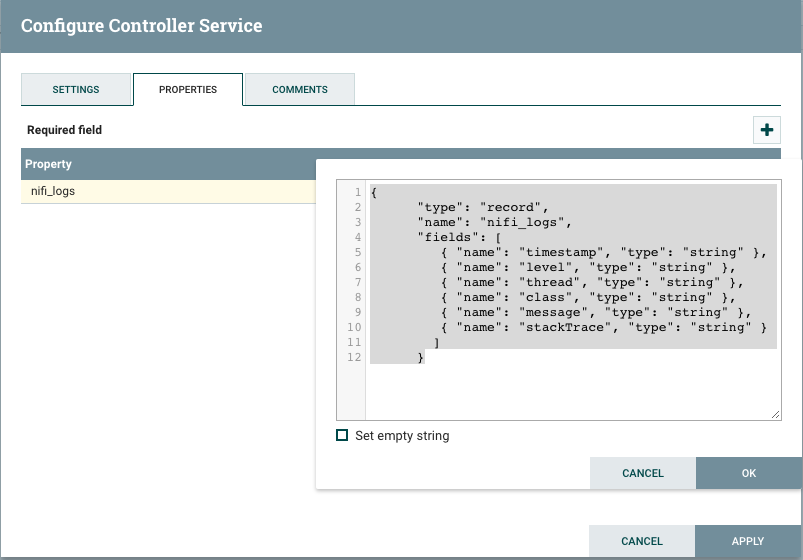
We’ll use the same nifi_logs schema from a previous post:
{ "type": "record", "name": "nifi_logs", "fields": [ { "name": "timestamp", "type": "string" }, { "name": "level", "type": "string" }, { "name": "thread", "type": "string" }, { "name": "class", "type": "string" }, { "name": "message", "type": "string" }, { "name": "stackTrace", "type": "string" } ] } -
Create an AvroSchemaRegistry service with the nifi_logs schema:
-
Create a GrokReader that uses the nifi_logs schema from the AvroSchemaRegistry:
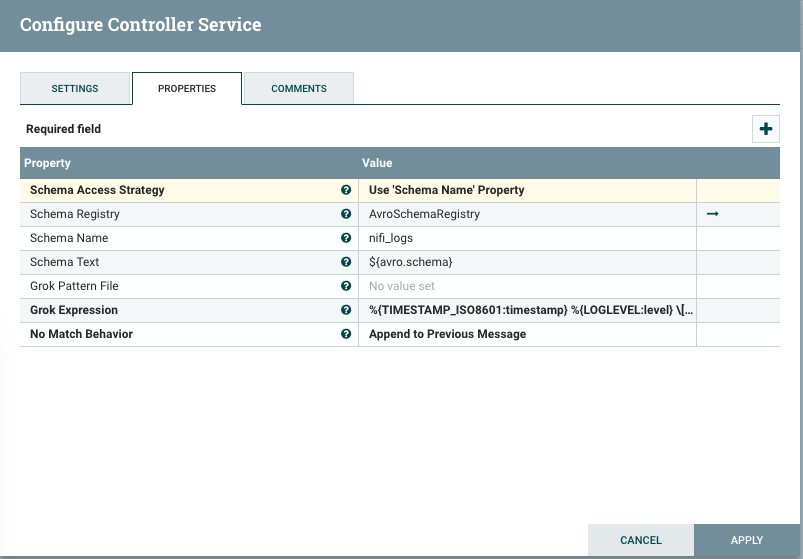
The grok expression to use in the GrokReader is the following:
%{TIMESTAMP_ISO8601:timestamp} %{LOGLEVEL:level} \[%{DATA:thread}\] %{DATA:class} %{GREEDYDATA:message}NOTE: We aren’t using expression language for the schema name in the reader properties because this reader is going to be used by a source processor so there won’t be a dynamic schema name coming from a flow file.
-
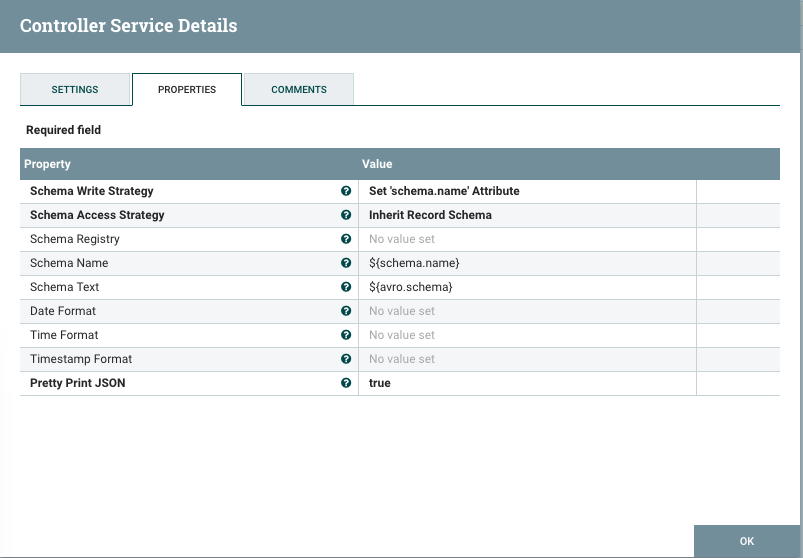
Create a JsonRecordSetWriter that inherits the schema from the reader:
-
Create a ListenTCPRecord processor that uses the above reader and writer, and sends to a LogAttribute processor:
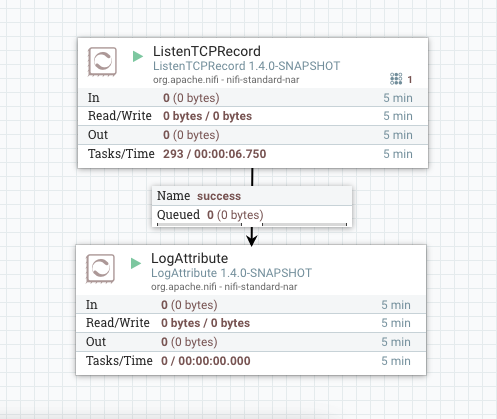
At this point the listening side is setup waiting to receive some logs, so we can create another part of the flow to simulate some data.
-
Create a GenerateFlowFile processor (change the run schedule to something reasonable) and set the Custom Text to the example log messages from the additional details of the GrokReader:
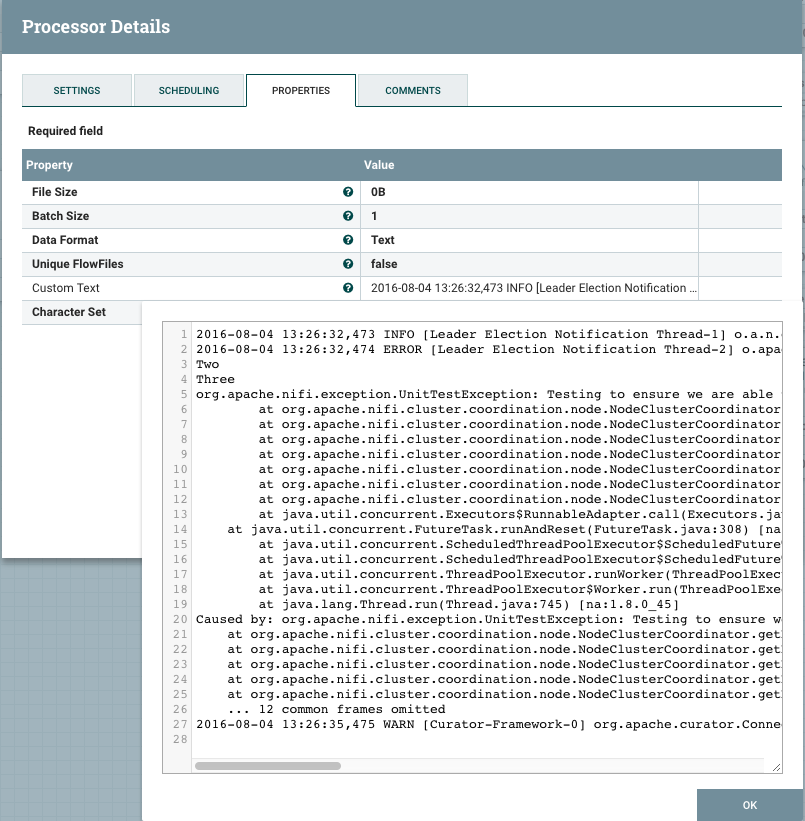
Notice this example data has three log messages (INFO, ERROR, & WARN) where the second message contains a stack-trace.
-
Connect GenerateFlowFile to a PutTCP processor that sends to the same port that ListenTCPRecord is listening on:
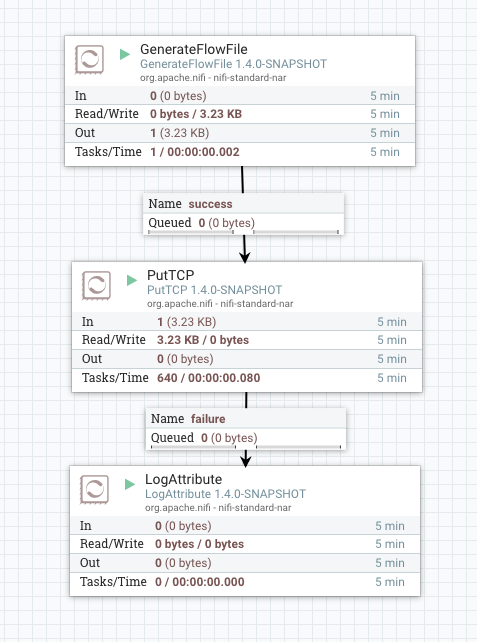
Once the entire flow is running you should see flow files going through PutTCP and coming out of ListenTCPRecord.
The example data has three log messages in it, where the second message includes a stack-trace, so the important part is that this gets treated as three records. If we look in nifi-app.log we should see the JSON output of those records:
  [ {
  "timestamp" : "2016-08-04 13:26:32,473",
  "level" : "INFO",
  "thread" : "Leader Election Notification Thread-1",
  "class" : "o.a.n.c.l.e.CuratorLeaderElectionManager",
  "message" : "org.apache.nifi.controller.leader.election.CuratorLeaderElectionManager$ElectionListener@1fa27ea5 has been interrupted; no longer leader for role 'Cluster Coordinator'",
  "stackTrace" : null
  }, {
  "timestamp" : "2016-08-04 13:26:32,474",
  "level" : "ERROR",
  "thread" : "Leader Election Notification Thread-2",
  "class" : "o.apache.nifi.controller.FlowController",
  "message" : "One\nTwo\nThree",
  "stackTrace" : "org.apache.nifi.exception.UnitTestException: Testing to ensure we are able to capture stack traces\n ..."
  }, {
  "timestamp" : "2016-08-04 13:26:35,475",
  "level" : "WARN",
  "thread" : "Curator-Framework-0",
  "class" : "org.apache.curator.ConnectionState",
  "message" : "Connection attempt unsuccessful after 3008 (greater than max timeout of 3000). Resetting connection and trying again with a new connection.\n",
  "stackTrace" : null
  } ]
I’ve omitted the full stack-trace on the second message, but you can see that the data coming over the TCP connection was correctly read as three separate records, and then written out as the JSON representation of those records.
Summary
Leveraging the existing record readers provides a powerful alternative to the traditional network listening processors. In addition to ListenTCPRecord, there is also a ListenUDPRecord counterpart. Since UDP is connection-less, we don’t have an InputStream to read from, but we can still use a record reader to interpret the bytes of each datagram as a series of records.
The template for the example flow in this post is available here:
blog comments powered by Disqus